Blog Layout

What is Discordance?


Guest blog by Nick Birch, FRCS (Orth)

The diagnostic categories of bone density include normal, osteopenia and osteoporosis. The reference level of bone density is that of a healthy 30-year-old adult, an age that is chosen as it represents “peak bone mass” i.e. the best bone density a person can expect to have in normal circumstances. If everyone was the same, it would be expected that they would all have normal bone at the age of 30 and that over time there would be a reduction of bone density with age and in women with the onset of menopause. However, everyone is not the same. There is considerable variation in height, weight, levels of physical activity, diet and background medical conditions. As a result, the three diagnostic categories, which are very much a “one size fits all” set of labels, do not adequately describe the bone health of significant proportions of the population.


Bone density varies with build. People with a higher body mass index have an increased bone density compared to people with a lower body mass index. In women sustaining a low-energy fragility fracture, only a third have a DXA diagnosis of osteoporosis i.e. low bone density. The other two thirds have diagnoses of osteopenia or normal bone density. This demonstrates that it is not just the bone density that determines fractures, but other factors as well. One of the most important of these is bone toughness (bone quality or bone strength). Toughness comes about as a result of repeated impact exercise when the underlying condition of bone is normal i.e. there are no medical reasons for bone to be weak. 


For example, a person with a low body mass index who is extremely active will have a low bone density commensurate with their build, but their bone toughness is likely to be good. Therefore, they may be less likely to fracture than an overweight, unfit person who will have better bone density but poor bone quality.


In most people the diagnostic category for the hip and the spine will be the same, but if the T-scores are close to the boundary between diagnostic categories they can be different. This difference is called discordance. But does this mean there is more like to be a fracture in one part compared to the other because one diagnosis is worse than the other? To understand these questions the original definitions of Normal, Osteopenia and Osteoporosis need to be revisited.


Osteoporosis is defined by the World Health Organization (WHO) as: A systemic condition characterized by low bone mineral density (BMD) in the osteoporosis range measured by bone densitometry (T score < -2.5) or a significant fracture risk based on fracture risk assessment e.g. FRAX with or without fragility (low trauma) fractures.


Systemic means affecting the whole body and, in this case, refers to the whole skeleton. Generally, in premenopausal women, it is expected that the bone density of the spine and hips will of the same order of magnitude unless there are specific reasons for them to be different such as playing sport where the impact is taken more on one lower limb than the other.


In postmenopausal women there often is more variation, which can also be the case in people who have specific reasons not to use certain parts of their bodies such as those who have suffered paralysis because of a stroke or an injury resulting in prolonged off-loading of a lower extremity.


When the T-scores fall into the same WHO diagnostic category (normal, osteopenia, osteoporosis) they are defined as being concordant. If they fall into different WHO diagnostic categories, they are discordant.


A minor discordance is defined as T-scores in adjacent WHO diagnostic categories of bone density:

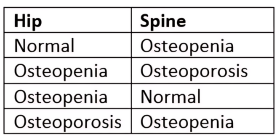
A major discordance is present if either the hip or spine T-score is normal and the other is osteoporotic.


Even if T-scores at hip and in the spine put a woman’s bone density into the same WHO diagnostic category, large differences between T-scores e.g. -2.5 at the hip and -4.7 in the spine need to be explained if there is no clear clinical reason why such a difference exists.


There are several reasons for discordance:


Physiological              The skeleton’s adaptive reaction to mechanical strain

Pathophysiological   A disease state affecting the skeleton

Anatomical                  Differences between sites in content of cortical and trabecular bone and/or rate of  bone loss

Artefactual                  The presence of manmade items within the region of interest of the test

Technical                      Faulty device hardware or software or the technologist’s method of acquiring or analyzing the test


Physiological, pathophysiological and anatomical reasons for discordance refer to clinical variation and they are therefore unrelated to the actual bone density test.


Anatomical reasons include the different distribution of hard (cortical) bone and softer (cancellous) bone in the hip and spine. With advancing age, an increased incidence of degenerative conditions in the spine and hip (e.g. arthritis) can cause errors in DXA analysis leading to discordant results. Other factors include ages of onset of menarche (puberty) and menopause (more discordance with late menarche and early menopause), Body Mass Index (less discordance with obesity) and secondary causes of osteoporosis (chronic inflammatory conditions and long-term use of some medications can predispose to discordance). In addition, some populations that are prone to vitamin D deficiency (women in Muslim communities wearing the Burka and Niqab) show different rates of discordance compared to populations that are more exposed to sunlight.


Artifactual and technical reasons for discordance are the result of equipment calibration and operator error and can be eliminated by strict adherence to correct bone densitometry principles and practice. For DXA the latter include correct patient positioning and interpretation of the x-ray images. Neither of these are relevant for REMS scans.


Six studies published between 2000 and 2014 showed the rates of concordance and discordance as:


Concordance                         48% - 58%

Minor discordance                35% - 46%

Major Discordance                2% - 17%


Reference Files:

Summary of studies reporting the rates of T-score concordance and discordance

Details of concordance and discordance rates in studies of DXA performance


In 2023 Young and Birch presented their results of REMS discordance rates showing a minor diagnostic discordance rate of 15%, a numerical discordance rate (i.e. a difference between T-scores of the hip and spine of < 1.0) of 6.5% and a major discordance rate of 0.0%.


If a woman has a DEXA scan showing a major discordance, or a T-score discrepancy of more than 1.0 and she has no obvious reasons for such a result, she should query the DXA result with the local unit. If a reasonable answer is not forthcoming, asking for a second opinion with a bone density scan performed either on a different DXA machine or with alternative technology e.g. REMS, is entirely reasonable and appropriate.

A group of women are sitting on yoga mats in a room.
March 24, 2025
I’m Active, Eat Right, and Have Never Broken a Bone…Why is my Fragility Score Yellow or Red?!?!?!
A person is standing on a scale surrounded by fruits and vegetables.
March 17, 2025
I’m Active, Eat Right, and Have Never Broken a Bone…Why is my Fragility Score Yellow or Red?!?!?!
A group of older women are dancing together in a room.
September 23, 2024
Fall Prevention Week is September 23-27, 2024 . It coincides with the beginning of Autumn or Fall…how very punny. Falls are not funny though. Whenever a patient tells me they had a “bad” fall from a standing height, it sometimes indicates that they are in denial of their bone health. There are no “bad” falls from a standing height. There are falls that break bones and falls that do not break bones. Most of the resources on this website focus on technology to measure bone density and bone quality. While both components of bone are related to fracture risk, we cannot forget the importance of fall prevention. This blog post is not about high-impact injuries that result in broken bones, it is about preventing fractures resulting from a fall from a standing or sitting position. Why are these low energy falls such a big deal? These falls have the potential to become significant life changing events , especially if a fall results in a fracture. A history of fracture can increase the risk of subsequent fractures: Prior rib fracture can increase risk of vertebral body fractures by 2.3- fold Prior vertebral fracture can increase risk of subsequent vertebral fractures by 9.1-fold; new hip fracture by 7.1- fold; and wrist fracture by 2.3- fold Prior shoulder fracture can increase risk of new wrist fracture by 5-fold; new vertebral body fracture by 10-fold; and new hip fracture by 18-fold Prior wrist fracture can increase risk of vertebral body fracture by 37% The Center for Disease Control has estimated the rate of death from falls increased 30% from 2007 to 2016. If this rate continues to increase, there will be an estimated 7 deaths each hour related to falls. Falls can occur for many reasons, no matter your age. When younger people fall intact protective mechanisms may lead to a fall on an outstretched hand, resulting in a hand or wrist fracture. Older people have compromised protective mechanisms which may lead to a fall on their side, resulting in a hip fracture, or even a head injury. The CDC and National Council for Aging are excellent resources for learning about fall prevention. You can find a questionnaire to check your risk for falling here . While this information about falls may seem scary at first, it can empower you to talk to your health care provider about fall prevention. There are a number of simple in-office fall assessment tools available through your doctor or physical therapist. Ask about having your balance assessed. If your primary care doctor or orthopaedic surgeon are not able to assess you, ask for an assessment with a physical therapist. Here are some safety tips for you or for loved ones at home: Ask your loved one if they are concerned about falling. Be gentle and compassionate. God willing, we will all grow older, and most likely weaker. Notice if they are holding on to furniture or walls to move about the house, or have difficulty getting out of a chair. Discuss current health conditions. Have a list of current medications. Sometimes medications can make people dizzy, weak, or affect eyesight. Ask about their last eye exam and if they needed updated glasses. Do a home safety check. You can get a home safety checklist at the website listed above. Ask about fluid and food intake. Dehydration and low blood sugar can cause dizziness and lead to falls. Let’s not forget about pets. 66.4% of falls associated with cats and 31.3% of falls associated with dogs are from tripping over the animal Among people hospitalized for falls over pets, 79.9% were fractures 8.8% of pet-related injuries were caused by people tripping over a pet toy or food bowl Journal of Safety Research 2010 and WebMD 2010 Here are a few tips to consider: Walk the dog, don’t let the dog walk you Dog obedience training Clean food and water spills that can cause slip and falls Clear floors of pet toys and leashes Avoid bending over to pet an animal Crate your dog or put the dog outside when expecting company Be aware of your limitations and consider risk assessment before doing something you may consider stupid after sustaining an injury. If you have never tried ice-skating and you have decided that you want to try it as an older adult, you may consider doing a risk assessment. That assessment may go something like this: If I fall and break my wrist, will I be able to work and continue to earn money to pay my bills? If I broke my ankle, who will drive me around? For me, the answer is learning to ice-skate at my age is not worth the risk of a fracture. There are other activities I enjoy doing. Many patients have asked about skiing. If you have enjoyed skiing your entire life and you desire to continue this activity, do a risk assessment of the type of skiing you want to do. You may decide to stay away from black diamonds. You may decide you will be better off on green or blue slopes. You can still enjoy the activity as you age with some adjustments. At some point, you may decide that the activity no longer gives you the joy it did previously and you move on to something else. Situational awareness or mindfulness in the moment is key to fall prevention. Whenever a patient comes to me for treatment of a fracture, I ask about how the fracture occurred. Typically, the answer is related to a fall. I follow with, “How did you fall?”. A story unfolds. Many times the story involves doing too much at once, not paying attention, or not turning on a light at night and tripping on something. Slow down. Have a night light for those night-time trips to the bathroom. Avoid carrying 15 grocery bags into the house at one time. Carry 3-4 and make multiple trips. Being in the moment prevents falls. In summary, there are a number of reasons why a person may fall. Reasons may include medications or interactions of medications that cause dizziness; poor eyesight; muscular weakness, dehydration, low blood sugar, a cluttered home, lack of mindfulness, pets, and not knowing limitations. The CDC and the National Council on Aging are great resources to get started with assessing your risk or your loved one’s risk for falling. Each source provides tips for preventing falls. If you have experienced falls, please share that information with your doctor, physical therapist, or loved one. There is no shame in asking for help to prevent a fall. If you have a loved one who has fallen, please do not shame them. Treat them with the kindness and compassion you want for yourself. Respect their dignity. Preventing a fall is preventing a fracture.
September 3, 2024
Why Is My Doctor Trying to Scare the $h!t Out of Me?
August 23, 2024
Bone Health is Connected to Overall Health
A doctor examines the back of a patient 's neck
June 21, 2024
I recently received a question: why is my T score going up and my fragility score getting worse? This is a great question. Let's take this step by step. First let's address the T-score. When tracking bone health over time, we must evaluate the actual numbers for Bone Mineral Density (BMD), not T-score. The T-score is a nice way to get an overall picture of your BMD compared to a 30-year-old white female. It is easy to get sucked into comparing T-scores, as we have all been conditioned to look at T-scores. However, T-scores represent standard deviations on a graph, and they represent a range of numbers and not absolute values of BMD. Therefore, tracking bone density over time can only be done by comparing BMD values in g/cm 2 and expressing those changes as percentages compared to baseline and compared to the result immediately prior. There are several factors that cause the BMD and therefore T-scores to change including age, levels of activity, nutrition and build. In post-menopausal women, there is a natural reduction of BMD and T scores over time which can be slowed, and in some cases reversed, with attention to good nutritional balance and lots of impact and resistance exercise. These changes usually occur slowly and are often not detectable on DXA scans in under several years because the Least Significant Change (LSC) is 5-6% which is not sensitive enough to measure a few percentage points difference. REMS can detect such changes, usually at yearly intervals. Changes in BMD caused by increases or decreases in weight and thus Body Mass Index (BMI) occur more quickly, and these changes can often be detected by REMS over a period of months rather than years. If the change is sufficiently large, DXA will be able to detect it in similar timeframes. For simplicity, let’s say BMD in 2022 was 0.983 g/cm 2 . Then in 2024, BMD was 0.899 g/cm 2 . The change in BMD is calculated as follows: 0.899 - 0.983 = -0.084 This demonstrates a decrease BMD (g/cm 2 ) over 2 years. To find the percent change, divide -0.084 by the original BMD (g/cm 2 ) -0.084 ÷ 0.983 = -0.085 This indicates there was an 8.5% decrease in BMD (g/cm 2 ). Remember to take into consideration the LSC which are different for DXA and REMS. A generally accepted LSC for DXA is 5-6% . So, if the change in BMD over time is less than 5-6%, it is not necessarily a real change when measure by DXA. If the change is greater than 5-6%, it does represent a real change. LSC for REMS is 0.88-1.05% (0.88% for hip and 1.05% for spine) meaning it can detect smaller changes, often in shorter timeframes. In the example provided above, there was a real change in BMD, as 8.5% is greater than 5-6% for DXA and 0.88-1.05% for REMS. Fragility Score is an adimensional number from 0-100. The lower the score, the better. FS reflects the micro-architecture of the bone. The AI in REMS technology compares the acquired spectra from the patient to a reference database. If the patient’s spectra match the spectra of individuals who have fractured, the patient will be in the RED. If the patient’s spectra match the spectra of individuals in the database who did not fracture, then the patient will be in the GREEN. YELLOW indicates some individuals fracture, and some did not. There is a natural increase in FS over time which is in the range of 1.5 – 2.0% per year in post-menopausal women. If the difference in FS over, for instance three years, is 4-5, that change may be inconsequential, considering the LSC and the expected change with age. Remember, you are more than your T-scores or Z-scores. Knowledge brings empowerment and peace of mind.
A woman is sitting on the floor looking at a piece of paper
June 12, 2024
It is VERY common to see discrepancies in the values noted on DXA versus values noted on REMS. Without seeing the images from your DXA scan on a complete report, your physician is not able to pick apart the details of your DXA report. However, there are some common themes that we REMS users have seen. For a simple guide to understanding your DXA report, please see: Choplin, et al. "A practical approach to interpretation of dual-energy x-ray absorptiometry of bone density," Curr Radiol Rep (2014). During the development of REMS technology, REMS was compared to the "gold standard" of DXA. The performance of the DXAs for comparison was quality controlled, as was the performance of the REMS. In the community, DXA quality is not assured the same way that it is in a research scenario. The potential for errors is high for DXA. The potential for REMS errors is much lower given the precision of the technology. For reference, please see: Messina, et al. "Prevalence and type of errors in dual-energy x-ray absorptiometry." Eur Rad, Nov 2014. Fatima, et al. "Discordant interpretation of serial bone mineral density measurements by dual-energy x-ray absorptiometry using vendor's and institutional least significant changes: Serious impact on decision-making," World Journal of Nuclear Medicine, 2018, 236-240. Typically, the values on DXA hips, REMS spine, and REMS hips are similar. The DXA spine is typically the outlier. DXA spine values may be very negative and DXA hips and REMS spine and hips are not so negative. Why would your spine be one value and your hips a completely different value on DXA? Dr. Nick Birch and his colleague Maddy Young presented their data regarding discordance at the British Orthopaedic Research Society annual meeting in the autumn of 2023. Young M, Birch N. “Prevalence of major and minor discordance between hip and spine T-score using REMS: Implication for bone health assessment and patient management.” Orthop Procs. 2023;105-B(SUPP_16):46-46. If you are interested in learning about the development of REMS technology, or to have a couple of papers to share with your treating physicians about REMS, I recommend: Della Ciardo, et al. "Pulse-Echo Measurements of Bone Tissue, Techniques and Clinical Results at the Spine and Femur," Bone Quantitative Ultrasound. Advances in Experimental Medicine and Biology 1364. Pisani, et al. "Screening and early diagnosis of osteoporosis through x-ray and ultrasound- based techniques," World Journal of Radiology, 2013 Nov 28; 5(11): 398-410. ​Pisani et al. "Fragility Score: a REMS-based indicator for the prediction of incident fragility fractures at 5 years," Aging Clin Exp Res; 2023; 35(4): 763-773. This last paper is ground-breaking as it demonstrates the importance of consideration of bone quality in terms of fracture risk. This paper is mentioned in the 10-minute video tutorial, “ Understanding Your REMS Report ”. Here are some things you may consider: Was there a significant change between your baseline DXA and subsequent DXAs? Is it reasonable to obtain serial scans over the next couple of years? If there is no change and your bone density and quality are stable, is there a need for medication for bone health? If there is a precipitous decline in density or quality, would you consider medication? Be honest with yourself and your treating physician about what you are willing to do or not do to optimize your bone health. Have you had a fragility fracture? Fractures are the greatest predictors of future fractures. Are your labs normal? Receiving the diagnosis of osteoporosis can be overwhelming. Remember, you are more than your DXA T-score or Z-score.
The word abc is written on a blackboard next to a stack of books.
December 19, 2023
Medical Science is full of acronyms and special terms. We have included a list of those commonly used on this site.
October 21, 2023
It's the time of year when ghosts, goblins, and skeletons run the streets. Happy Halloween! I have fond memories of the excitement of making costumes and running around with friends on Halloween. Of course, getting a ton of candy was the goal, but what has lasted through the years are the memories of being with friends, having pride in making a costume, and learning how to broker deals - Bottlecaps for Dum-Dums. I continued that tradition with my son. Yep- he was a pumpkin, a Thomas the Tank Engine engineer, a TRex (his arms were not too short to grab candy), a baby tiger with mommy tiger, a SpiderMan Shark (yes, you read that correctly), Wolverine (old school Wolverine), and an Alien Hunter. The days of making costumes with him have passed, as his other interests have taken priority…for now. I enjoy sitting outside giving candy to kids in the neighborhood and reminiscing about walking around with my son as he lived up to his alter ego for the season. Whether you choose to venture out with little ones, or stay home to give out candy, take a moment to mitigate risks for a potential fall . Use a flashlight when walking the neighbor. Make sure the pathway to your calderon of candy is well-lit . Wear sensible shoes for walking. Fur babies that rush to the door when the doorbell rings, create a fall risk. Consider using a leash and have them accompany you to the door, or secure them in a crate or room during Trick-or-Treat hours. Make sure your eyesight is not blocked by a mask or costume. If you cannot see where you are going, you may find yourself kissing a curb. Ouch. Preventing a fall equals preventing a fracture. Oftentimes, people I meet with osteoporosis have fear of breaking a bone. They have been scared by other doctors who have put fear in their minds- fear of crumbling bones and falling apart. Life is meant to be lived. You will not disintegrate (unless an alien strolling your neighborhood gets you with a laser beam). Be smart. Do some risk management. And embrace living life to its fullest. Let me know if you score some Bottlecaps because I will trade some Razzles for Bottlecaps any day!
Share by: