Blog Layout

Part 1: Understanding the Impact of Statistics and Databases on Your DXA and REMS Test Results


I’m Active, Eat Right, and Have Never Broken a Bone…Why is my Fragility Score Yellow or Red?!?!?!

Authors:

Kimberly Zambito, MD, Orthopaedic Surgeon and Owner of Qualis Os

www.qualisos.com

Dr Nick Birch FRCS (Orth), Consultant Spine and Bone Health Specialist

www.osteoscanuk.com

Andrew Bush, MD, Orthopaedic Surgeon

www.centralcarolinaortho.com


Why is it that some people who do everything right still have a dismal T- score or Fragility Score? The answer to this question has many facets, but the underlying science is based on statistics, population health and screening for diseases.


DXA is considered the “gold standard” for screening for osteoporosis. Since DXA is considered the current gold standard, all other technologies used to evaluate bone mineral density (BMD) are compared to DXA. REMS is an ultrasound technology used in the evaluation of BMD that has been extensively verified against DXA. However, it is unique in being able to measure bone quality of the hips and spine through the fragility score (FS).


BMD is expressed either as g/cm2 or g/cm3. The first represents the value of an area of a bone surface that is being examined and the second the volume of the relevant bone. Areal values are obtained from DXA and REMS machines and volumetric values are obtained through a CT scan. In general, DXA and REMS are the more commonly used technologies, so your results are more likely to be reported as g/cm2.


The REMS Fragility Score is a measure of the structural quality of bone that is independent of the BMD. It measures bone toughness, which has been established as the most important contributor to future fracture risk.    Bone quality, or toughness, is comprised of bone density, microarchitecture, shape, along with other variables.


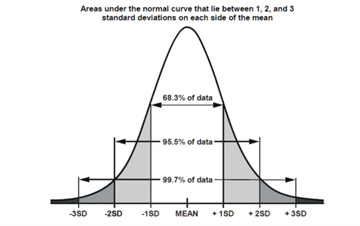
Whenever a screening technology is developed, data from a large number of people who have had the test are accumulated and stored in a database. As that database is progressively built, it comes to represent the variety of values of the test the target population will have. The larger the database, the more representative it will be of the general population. When we look at a “picture,” or graph, representing these data, most often it is in the form of a bell-shaped curve. This is called a “normal distribution” / “normal curve”. Most of the data points fall within a central band and clusters of values taper symmetrically on either side, creating the bell-shape.


A graph showing areas under the normal curve that lie between 1 and 3 standard deviations on each side of the mean

If we examine various parts of the curve the middle value is called the “median”. The “mean” is the average of all the datapoints and the “mode” is the most frequent value. In a perfect bell-shaped curve, all three fall at the highest point of the curve.


Normal distribution curves can be subdivided into equal segments which are called “standard deviations.” These represent the "spread" of the data where a larger standard deviation indicates a wider bell-shaped curve, and a smaller standard deviation indicates a narrower curve.


A black and white graph showing a normal curve

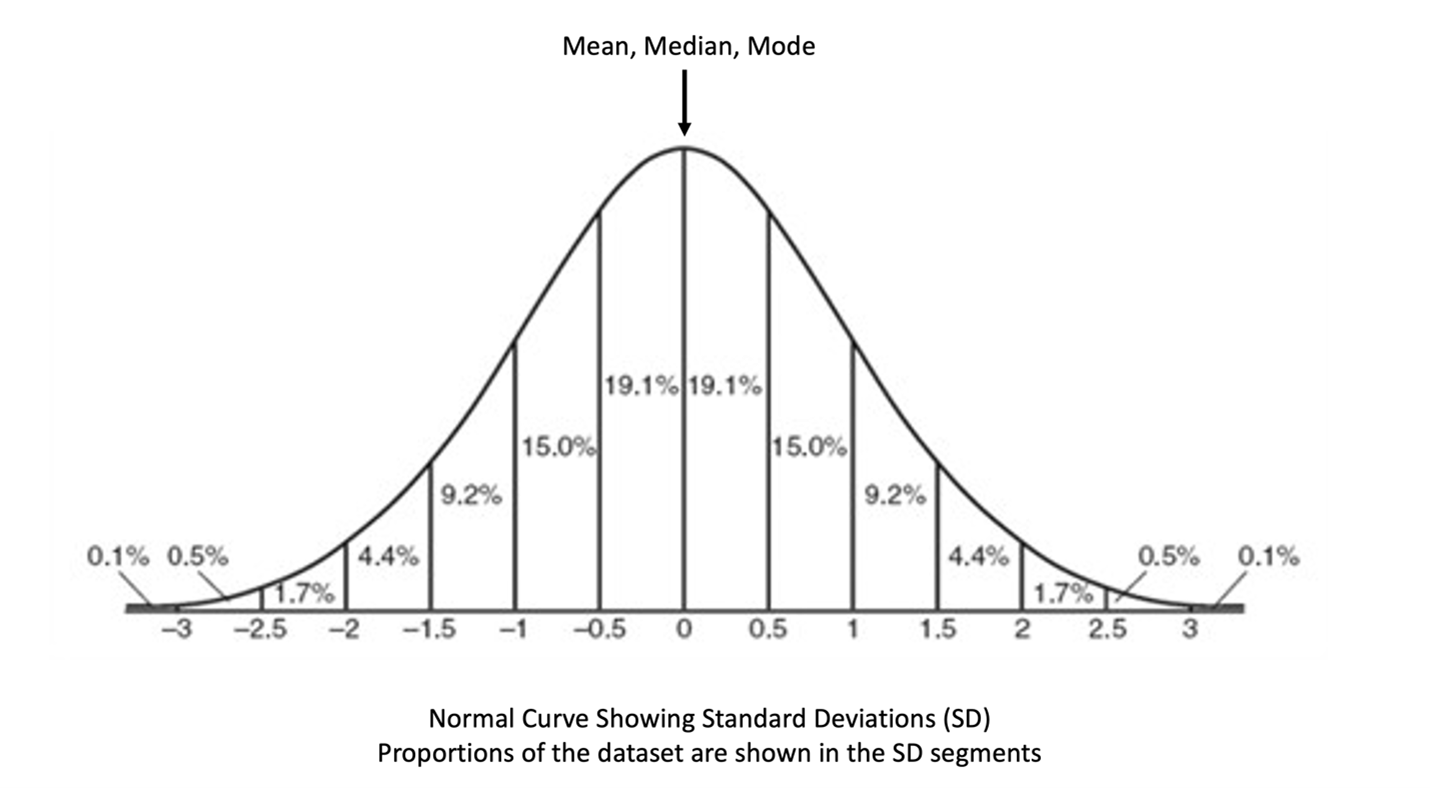
In general, when we interpret the information in a bell-shaped curve, we follow the “68-95-99” rule. Approximately 68% of data falls within one standard deviation of the mean, 95% within two standard deviations, and 99.7% within three standard deviations.


How is this applied to information in your DXA or REMS scan results for BMD? The first value to look at is your “Z score”. This represents the difference between your bone density and the average bone density for people of your age who are the same gender and ethnicity as you. If your BMD (in g/cm2) is close to the middle (or mean), then your Z-score will be close to “0”. If your BMD in g/cm2 falls away from the middle, it will be given a Z-score that shows how far away from the average your BMD is. Z-scores can be positive or negative depending on whether your bone density is above or below average for your age. Therefore, if your Z-score is -1.0, your BMD is 1 standard deviation lower than the average population for your age, gender, and ethnicity. If your Z-score is -1.5, then your BMD is 1.5 standard deviations lower than the average population for your age, gender, and ethnicity. The same applies with positive Z-scores with +1.0 being 1 standard deviation above average and +1.5 being 1.5 standard deviations greater than the average population for your age, gender, and ethnicity.


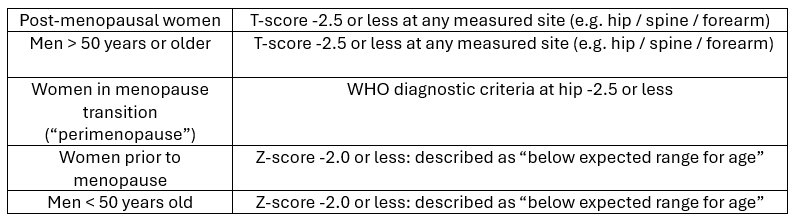
At this point you might wonder why there is all this talk about Z-scores when everyone knows that bone density is expressed as T-scores. The reason is because the two types of score show bone density by reference to different populations. As we have said, Z-scores compare you to people your age who are the same gender and ethnicity. T-scores compare your BMD to the BMD of young healthy adults, who happen to be white women between the ages of 20 and 29 years, irrespective of your gender and ethnicity. The intent of using T-scores is to express how much bone loss has occurred since the age of 30 in the general population and from these values the World Health Organisation (WHO) diagnostic categories of “normal”, “osteopenia” and “osteoporosis” are derived.  The table below shows how a diagnosis of osteoporosis is made in different groups of people.


A table showing the age ranges for men and women


Considering post-menopausal women, their T-scores show how much difference there is between their bone density and the bone density of young healthy white women, up to the age of 30, which is used as a reference. By 30 years of age, most women have reached “peak bone mass” which means they have the best bone density of their lives. From 30 to 40 years, bone mass is expected to remain stable, but after 40 there is a progressive loss of bone mass which is most rapid at the time of menopause and for the first 10 years afterwards. Unfortunately, most women do not know what their BMD or T-scores were at the age of 30 and if you do not know your starting point or baseline, how can it be assumed that you have lost a large amount of bone density by the time of the menopause? What if your baseline was low? Is it possible you have not lost much bone since you were 30? Is it possible you have lost bone density no more than anyone else through the aging process? After the age of 40 average bone loss is 0.5-1.0% per year except for women during the first decade after menopause when it can be as high as 2% per year (more statistical information from a database). How can we then understand who might be at risk of future fractures because of a deterioration of bone health after the age of 30? The simple answer is: Screening.


Screening is a process that involves checking for a disease or condition in people who appear healthy. So, screening for osteoporosis means we need to measure the bone density of people in the community by appropriate tests from which their T- and Z-scores are derived. Some people will have osteoporosis, and the test will show that to be the case because their T-scores or Z-scores are below the thresholds that define the diagnosis. These are “True Positive” results. Others won’t have osteoporosis, and the test will also show that to be the case as the T- or Z-scores will be above the diagnostic threshold (“True Negative” results). However, the test might not be completely accurate which means it could show a person who has osteoporosis as not having the condition  (“False negative” result) or vice versa, a person who doesn’t have osteoporosis is shown as having the condition (“False Positive”) result. The accuracy of any screening test depends on the relationship between the four possible outcomes. The higher the proportion of true positive and true negative cases the more accurate the test. Why is this important?


When we identify people at higher risk of having a disease, then we can offer preventive measures or treatment. Let’s look at an example of a screening tool used in general medicine. An electrocardiogram (EKG) is used to evaluate electrical impulses of the heart and can be useful in identifying irregular heart rhythms which can be life threatening. Bradycardia is defined as a low heart rate. Let’s say a cardiologist is reviewing an EKG. The EKG demonstrates a very low heart rate of 44 beats per minute. Is this a cause for concern? The answer is “it depends.” If this person is a 30-year-old endurance athlete, then there is, most likely, no cause for concern. If this person is an 80-year-old on cardiac medication who is feeling dizzy, then yes there is cause for concern. The information from these screening tools must be interpreted within the appropriate context.

DXA and REMS are technologies we use to screen for osteoporosis, and by implication, fracture risk. However, knowing a person’s T-score or Z-score in isolation is only part of the picture and the information gained from these tools does not define a person. The results from DXA and REMS are in essence “medical statistics” that need to be properly interpreted by a trained professional who knows how to apply the information in the correct context of your general health, specifically as it applies to your bone health. Remember, you are more than your DXA and REMS results. There is an ENTIRE you!


Coming soon -  Part 2: Understanding the Impact of Databases on Your Fragility Score and Fracture Risk

A group of women are sitting on yoga mats in a room.
March 24, 2025
I’m Active, Eat Right, and Have Never Broken a Bone…Why is my Fragility Score Yellow or Red?!?!?!
A group of older women are dancing together in a room.
September 23, 2024
Fall Prevention Week is September 23-27, 2024 . It coincides with the beginning of Autumn or Fall…how very punny. Falls are not funny though. Whenever a patient tells me they had a “bad” fall from a standing height, it sometimes indicates that they are in denial of their bone health. There are no “bad” falls from a standing height. There are falls that break bones and falls that do not break bones. Most of the resources on this website focus on technology to measure bone density and bone quality. While both components of bone are related to fracture risk, we cannot forget the importance of fall prevention. This blog post is not about high-impact injuries that result in broken bones, it is about preventing fractures resulting from a fall from a standing or sitting position. Why are these low energy falls such a big deal? These falls have the potential to become significant life changing events , especially if a fall results in a fracture. A history of fracture can increase the risk of subsequent fractures: Prior rib fracture can increase risk of vertebral body fractures by 2.3- fold Prior vertebral fracture can increase risk of subsequent vertebral fractures by 9.1-fold; new hip fracture by 7.1- fold; and wrist fracture by 2.3- fold Prior shoulder fracture can increase risk of new wrist fracture by 5-fold; new vertebral body fracture by 10-fold; and new hip fracture by 18-fold Prior wrist fracture can increase risk of vertebral body fracture by 37% The Center for Disease Control has estimated the rate of death from falls increased 30% from 2007 to 2016. If this rate continues to increase, there will be an estimated 7 deaths each hour related to falls. Falls can occur for many reasons, no matter your age. When younger people fall intact protective mechanisms may lead to a fall on an outstretched hand, resulting in a hand or wrist fracture. Older people have compromised protective mechanisms which may lead to a fall on their side, resulting in a hip fracture, or even a head injury. The CDC and National Council for Aging are excellent resources for learning about fall prevention. You can find a questionnaire to check your risk for falling here . While this information about falls may seem scary at first, it can empower you to talk to your health care provider about fall prevention. There are a number of simple in-office fall assessment tools available through your doctor or physical therapist. Ask about having your balance assessed. If your primary care doctor or orthopaedic surgeon are not able to assess you, ask for an assessment with a physical therapist. Here are some safety tips for you or for loved ones at home: Ask your loved one if they are concerned about falling. Be gentle and compassionate. God willing, we will all grow older, and most likely weaker. Notice if they are holding on to furniture or walls to move about the house, or have difficulty getting out of a chair. Discuss current health conditions. Have a list of current medications. Sometimes medications can make people dizzy, weak, or affect eyesight. Ask about their last eye exam and if they needed updated glasses. Do a home safety check. You can get a home safety checklist at the website listed above. Ask about fluid and food intake. Dehydration and low blood sugar can cause dizziness and lead to falls. Let’s not forget about pets. 66.4% of falls associated with cats and 31.3% of falls associated with dogs are from tripping over the animal Among people hospitalized for falls over pets, 79.9% were fractures 8.8% of pet-related injuries were caused by people tripping over a pet toy or food bowl Journal of Safety Research 2010 and WebMD 2010 Here are a few tips to consider: Walk the dog, don’t let the dog walk you Dog obedience training Clean food and water spills that can cause slip and falls Clear floors of pet toys and leashes Avoid bending over to pet an animal Crate your dog or put the dog outside when expecting company Be aware of your limitations and consider risk assessment before doing something you may consider stupid after sustaining an injury. If you have never tried ice-skating and you have decided that you want to try it as an older adult, you may consider doing a risk assessment. That assessment may go something like this: If I fall and break my wrist, will I be able to work and continue to earn money to pay my bills? If I broke my ankle, who will drive me around? For me, the answer is learning to ice-skate at my age is not worth the risk of a fracture. There are other activities I enjoy doing. Many patients have asked about skiing. If you have enjoyed skiing your entire life and you desire to continue this activity, do a risk assessment of the type of skiing you want to do. You may decide to stay away from black diamonds. You may decide you will be better off on green or blue slopes. You can still enjoy the activity as you age with some adjustments. At some point, you may decide that the activity no longer gives you the joy it did previously and you move on to something else. Situational awareness or mindfulness in the moment is key to fall prevention. Whenever a patient comes to me for treatment of a fracture, I ask about how the fracture occurred. Typically, the answer is related to a fall. I follow with, “How did you fall?”. A story unfolds. Many times the story involves doing too much at once, not paying attention, or not turning on a light at night and tripping on something. Slow down. Have a night light for those night-time trips to the bathroom. Avoid carrying 15 grocery bags into the house at one time. Carry 3-4 and make multiple trips. Being in the moment prevents falls. In summary, there are a number of reasons why a person may fall. Reasons may include medications or interactions of medications that cause dizziness; poor eyesight; muscular weakness, dehydration, low blood sugar, a cluttered home, lack of mindfulness, pets, and not knowing limitations. The CDC and the National Council on Aging are great resources to get started with assessing your risk or your loved one’s risk for falling. Each source provides tips for preventing falls. If you have experienced falls, please share that information with your doctor, physical therapist, or loved one. There is no shame in asking for help to prevent a fall. If you have a loved one who has fallen, please do not shame them. Treat them with the kindness and compassion you want for yourself. Respect their dignity. Preventing a fall is preventing a fracture.
September 3, 2024
Why Is My Doctor Trying to Scare the $h!t Out of Me?
August 23, 2024
Bone Health is Connected to Overall Health
July 17, 2024
Guest blog by Nick Birch, FRCS (Orth)
A doctor examines the back of a patient 's neck
June 21, 2024
I recently received a question: why is my T score going up and my fragility score getting worse? This is a great question. Let's take this step by step. First let's address the T-score. When tracking bone health over time, we must evaluate the actual numbers for Bone Mineral Density (BMD), not T-score. The T-score is a nice way to get an overall picture of your BMD compared to a 30-year-old white female. It is easy to get sucked into comparing T-scores, as we have all been conditioned to look at T-scores. However, T-scores represent standard deviations on a graph, and they represent a range of numbers and not absolute values of BMD. Therefore, tracking bone density over time can only be done by comparing BMD values in g/cm 2 and expressing those changes as percentages compared to baseline and compared to the result immediately prior. There are several factors that cause the BMD and therefore T-scores to change including age, levels of activity, nutrition and build. In post-menopausal women, there is a natural reduction of BMD and T scores over time which can be slowed, and in some cases reversed, with attention to good nutritional balance and lots of impact and resistance exercise. These changes usually occur slowly and are often not detectable on DXA scans in under several years because the Least Significant Change (LSC) is 5-6% which is not sensitive enough to measure a few percentage points difference. REMS can detect such changes, usually at yearly intervals. Changes in BMD caused by increases or decreases in weight and thus Body Mass Index (BMI) occur more quickly, and these changes can often be detected by REMS over a period of months rather than years. If the change is sufficiently large, DXA will be able to detect it in similar timeframes. For simplicity, let’s say BMD in 2022 was 0.983 g/cm 2 . Then in 2024, BMD was 0.899 g/cm 2 . The change in BMD is calculated as follows: 0.899 - 0.983 = -0.084 This demonstrates a decrease BMD (g/cm 2 ) over 2 years. To find the percent change, divide -0.084 by the original BMD (g/cm 2 ) -0.084 ÷ 0.983 = -0.085 This indicates there was an 8.5% decrease in BMD (g/cm 2 ). Remember to take into consideration the LSC which are different for DXA and REMS. A generally accepted LSC for DXA is 5-6% . So, if the change in BMD over time is less than 5-6%, it is not necessarily a real change when measure by DXA. If the change is greater than 5-6%, it does represent a real change. LSC for REMS is 0.88-1.05% (0.88% for hip and 1.05% for spine) meaning it can detect smaller changes, often in shorter timeframes. In the example provided above, there was a real change in BMD, as 8.5% is greater than 5-6% for DXA and 0.88-1.05% for REMS. Fragility Score is an adimensional number from 0-100. The lower the score, the better. FS reflects the micro-architecture of the bone. The AI in REMS technology compares the acquired spectra from the patient to a reference database. If the patient’s spectra match the spectra of individuals who have fractured, the patient will be in the RED. If the patient’s spectra match the spectra of individuals in the database who did not fracture, then the patient will be in the GREEN. YELLOW indicates some individuals fracture, and some did not. There is a natural increase in FS over time which is in the range of 1.5 – 2.0% per year in post-menopausal women. If the difference in FS over, for instance three years, is 4-5, that change may be inconsequential, considering the LSC and the expected change with age. Remember, you are more than your T-scores or Z-scores. Knowledge brings empowerment and peace of mind.
A woman is sitting on the floor looking at a piece of paper
June 12, 2024
It is VERY common to see discrepancies in the values noted on DXA versus values noted on REMS. Without seeing the images from your DXA scan on a complete report, your physician is not able to pick apart the details of your DXA report. However, there are some common themes that we REMS users have seen. For a simple guide to understanding your DXA report, please see: Choplin, et al. "A practical approach to interpretation of dual-energy x-ray absorptiometry of bone density," Curr Radiol Rep (2014). During the development of REMS technology, REMS was compared to the "gold standard" of DXA. The performance of the DXAs for comparison was quality controlled, as was the performance of the REMS. In the community, DXA quality is not assured the same way that it is in a research scenario. The potential for errors is high for DXA. The potential for REMS errors is much lower given the precision of the technology. For reference, please see: Messina, et al. "Prevalence and type of errors in dual-energy x-ray absorptiometry." Eur Rad, Nov 2014. Fatima, et al. "Discordant interpretation of serial bone mineral density measurements by dual-energy x-ray absorptiometry using vendor's and institutional least significant changes: Serious impact on decision-making," World Journal of Nuclear Medicine, 2018, 236-240. Typically, the values on DXA hips, REMS spine, and REMS hips are similar. The DXA spine is typically the outlier. DXA spine values may be very negative and DXA hips and REMS spine and hips are not so negative. Why would your spine be one value and your hips a completely different value on DXA? Dr. Nick Birch and his colleague Maddy Young presented their data regarding discordance at the British Orthopaedic Research Society annual meeting in the autumn of 2023. Young M, Birch N. “Prevalence of major and minor discordance between hip and spine T-score using REMS: Implication for bone health assessment and patient management.” Orthop Procs. 2023;105-B(SUPP_16):46-46. If you are interested in learning about the development of REMS technology, or to have a couple of papers to share with your treating physicians about REMS, I recommend: Della Ciardo, et al. "Pulse-Echo Measurements of Bone Tissue, Techniques and Clinical Results at the Spine and Femur," Bone Quantitative Ultrasound. Advances in Experimental Medicine and Biology 1364. Pisani, et al. "Screening and early diagnosis of osteoporosis through x-ray and ultrasound- based techniques," World Journal of Radiology, 2013 Nov 28; 5(11): 398-410. ​Pisani et al. "Fragility Score: a REMS-based indicator for the prediction of incident fragility fractures at 5 years," Aging Clin Exp Res; 2023; 35(4): 763-773. This last paper is ground-breaking as it demonstrates the importance of consideration of bone quality in terms of fracture risk. This paper is mentioned in the 10-minute video tutorial, “ Understanding Your REMS Report ”. Here are some things you may consider: Was there a significant change between your baseline DXA and subsequent DXAs? Is it reasonable to obtain serial scans over the next couple of years? If there is no change and your bone density and quality are stable, is there a need for medication for bone health? If there is a precipitous decline in density or quality, would you consider medication? Be honest with yourself and your treating physician about what you are willing to do or not do to optimize your bone health. Have you had a fragility fracture? Fractures are the greatest predictors of future fractures. Are your labs normal? Receiving the diagnosis of osteoporosis can be overwhelming. Remember, you are more than your DXA T-score or Z-score.
The word abc is written on a blackboard next to a stack of books.
December 19, 2023
Medical Science is full of acronyms and special terms. We have included a list of those commonly used on this site.
October 21, 2023
It's the time of year when ghosts, goblins, and skeletons run the streets. Happy Halloween! I have fond memories of the excitement of making costumes and running around with friends on Halloween. Of course, getting a ton of candy was the goal, but what has lasted through the years are the memories of being with friends, having pride in making a costume, and learning how to broker deals - Bottlecaps for Dum-Dums. I continued that tradition with my son. Yep- he was a pumpkin, a Thomas the Tank Engine engineer, a TRex (his arms were not too short to grab candy), a baby tiger with mommy tiger, a SpiderMan Shark (yes, you read that correctly), Wolverine (old school Wolverine), and an Alien Hunter. The days of making costumes with him have passed, as his other interests have taken priority…for now. I enjoy sitting outside giving candy to kids in the neighborhood and reminiscing about walking around with my son as he lived up to his alter ego for the season. Whether you choose to venture out with little ones, or stay home to give out candy, take a moment to mitigate risks for a potential fall . Use a flashlight when walking the neighbor. Make sure the pathway to your calderon of candy is well-lit . Wear sensible shoes for walking. Fur babies that rush to the door when the doorbell rings, create a fall risk. Consider using a leash and have them accompany you to the door, or secure them in a crate or room during Trick-or-Treat hours. Make sure your eyesight is not blocked by a mask or costume. If you cannot see where you are going, you may find yourself kissing a curb. Ouch. Preventing a fall equals preventing a fracture. Oftentimes, people I meet with osteoporosis have fear of breaking a bone. They have been scared by other doctors who have put fear in their minds- fear of crumbling bones and falling apart. Life is meant to be lived. You will not disintegrate (unless an alien strolling your neighborhood gets you with a laser beam). Be smart. Do some risk management. And embrace living life to its fullest. Let me know if you score some Bottlecaps because I will trade some Razzles for Bottlecaps any day!
Share by: