Part 2: Understanding the Development of the Fragility Score
I’m Active, Eat Right, and Have Never Broken a Bone…Why is my Fragility Score Yellow or Red?!?!?!
Authors:
Kimberly Zambito, MD, Orthopaedic Surgeon and Owner of Qualis Os
Dr Nick Birch FRCS (Orth), Consultant Spine and Bone Health Specialist
Andrew Bush, MD, Orthopaedic Surgeon
Databases are used in many aspects of our everyday lives. When making a database, information from the general population, or a specific activity such as scientific research, is collected and then compiled in a centralized location in an organized manner for consistency and accessibility. Once the information is collected and organized in the database the information can be searched in multiple ways to answer a range of questions, and it therefore becomes very valuable. The information in a database, when correctly evaluated and analyzed, can then be used to help make decisions or predictions. With information gathered into an organized database, patterns will be observed and trends can be determined.
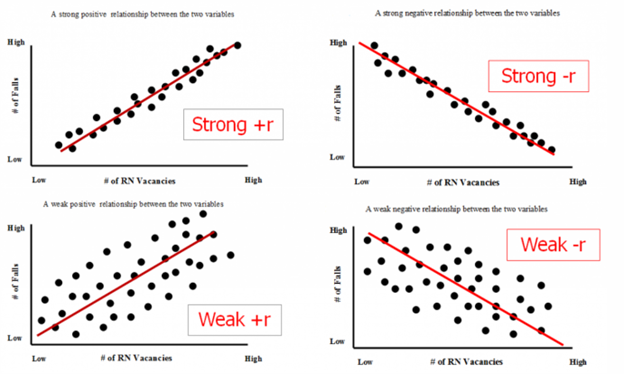
Often the collected data in a database will be represented in scattergrams or scatter graphs. These can be used to compare a range of “variables”. Variables are the things that change when something is being observed. For instance, if you were plotting the change in the temperature at noon each day, you would need to record the date as one variable and the temperature as the other. The illustrations below demonstrate scattergrams that show what the kinds of relationships between variables might look like. If the variables are highly correlated (noontime temperature and month of the year for instance) the scattergram shows a strongly positive trend (the “r” number is “+”). The opposite trend is strongly negative ( “-r”) which might for example reflect the relationship between the bank balance and level of gambling activity of a person who habitually loses at the tables when they visit Las Vegas. Both strongly positive and strongly negative trends reflect a narrow range of variables in well-defined situations. Weakly positive and weakly negative correlations are common in life, particularly in medicine, usually because there are a range of variables affecting an outcome and picking just one to try to correlate to that outcome means that only part of the picture is shown. The relationship of fracture risk and age is a good example of a weak correlation as there are many more factors that affect a person’s likelihood of fracturing than just their age.
Statistical analysis can be performed on the data from the database that contributes to a scatterplot. When the appropriate statistics are applied to the contents of a database an average can be calculated. The average will provide the data value with the most common property or feature that would best represent all the data in the database. This information can then be used to anticipate patterns and trends and develop expectations to be used in the general population.
In REMS, a value known as the Fragility Score is obtained during testing. The obtained value is applied to a scattergram to determine the chance of sustaining a fragility fracture:
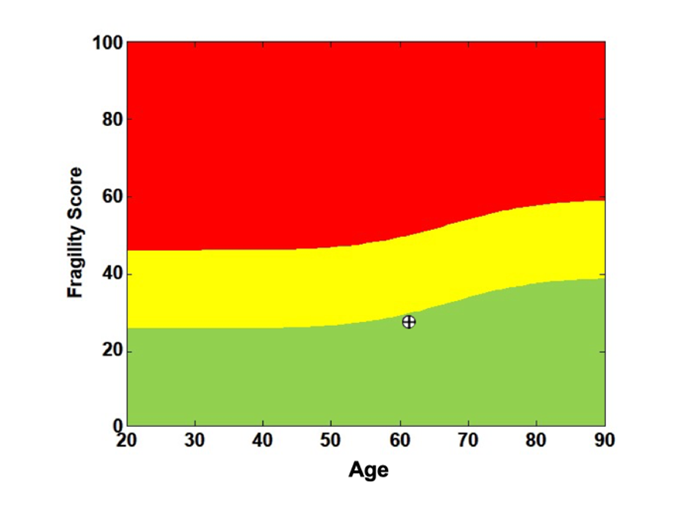
The Fragility Score graph on the second page of a standard REMS report represents the likelihood that someone will fracture based on age (x-axis) and the measured Fragility Score (y-axis). The result for any one scan is shown as circle with a cross inside and this is part of a “scattergram”, the rest of which is hidden. The database that allowed the scattergram of the FS values to be created came from people who had had REMS scans and whose fracture history was known. When this database was being created, the FS of individuals who had no history of a fragility fracture were placed on the graph with a green dot. The FS of individuals who had sustained a fragility fracture were placed with a red dot. This means that no one in the green-zone has fractured, whereas everyone in the red-zone has fractured.
The yellow is an add-on color covering up the zone of overlapping green and red dots. In the yellow-zone, near the green-zone, most people have not fractured but a few have (if you could peek under the yellow ribbon you would see many green dots and only a few red ones). In the yellow-zone near the red-zone most individuals have had a fragility fracture, but a few have not (mainly red dots under the yellow ribbon with a few green). Fracture risk can then be determined by combining the information from the first two pages of the REMS report- bone mineral density and Fragility Score. As a preventative medicine tool, the Fragility Score which is a reflection of the bone quality has impact on fracture risk assessment.
REMS is a powerful bone health screening tool, and it has similarities to other screening technologies such as mammography. Mammography is recommended on a yearly basis not to assess the health of the breast but to identify a density or mass that was not present on the prior exam. Similarly, REMS assessments are recommended on a yearly basis for women who are postmenopausal to look for significant (catastrophic) bone loss as could happen with a change in lifestyle or the development of medical conditions that affect bone health. The REMS FS slowly rises with age, but if the trend does not significantly vary from what is expected as “normal” it will indicate stable bone health. Refer to a prior blog regarding understanding changes in DXA or REMS.
While the Fragility Score is more predictive of fracture risk than BMD by DXA or REMS, it is not perfect. Like all the other methods used to estimate fracture risk, it is based on statistics, and statistics are based on data collected from a defined population. There are factors that can affect how statistics can be applied in an individual clinical scenario that are dependent on the data collection technique and the population chosen:
- Who collected the data and how was it collected?
- Who comprised the database?
- How many individuals are in the data base?
As the scattergrams above show, for a weakly positive trend, there is a large range of data points that do not lie near the trend line. Many of these will represent individuals who will be considered “outliers”; therefore, the statistics and the graphs may not correctly represent such an individual’s condition.
Statistics when used appropriately are powerful predictors of trends and the likelihood that an event will occur. However, there are circumstances when the prediction will not be correct.
REMS is a technology we use to screen for fracture risk. The information gained from this powerful medical screening device does not define you, but helps medical professionals advise you on how to mitigate your fracture risk. It is critical to engage a trained medical professional who knows how to apply this information in the correct context for your health.
Coming soon - Part 3: Estimating your risk of a future fracture due to impaired bone health: Is Fracture Risk Really Age-Dependent?